The Economic Divide
Blue and Red States Still Reflect Original Differences
If we imagine the Blue states and Red states as separate nations, Blue Nation and Red Nation would rank second and third in world GDP, respectively. (1) Blue Nation accounts for nearly half of US GDP, and more than Red, even though the population of Red Nation is greater than Blue Nation’s. This is reflected in the nearly $20,000 greater median household income in the Blue Nation. Union density in Blue Nation is half again what it is in Red Nation, and a greater percentage of those living in Blue Nation have a college degree.
Economic Foundations
From the founding, the states that are now Red and Blue have organized their economic activity and labor relations in very different ways. The economic foundation of the Red Nation began as, and continues to be, an evolving set of extractive industries, while the foundation of the Blue Nation began as and continues to be an evolving set of commercial, financial and globalized enterprises.
In terms of BLS sector classification, 7 percent more of Blue Nation’s workers are employed in education and health services, professional services, and financial activities, while 7 percent more of Red Nation’s workers are employed in manufacturing, trade, transportation, utilities, construction, and natural resource extraction. But this high-level comparison masks that within nearly every one of those categories, Blue Nation workers earn much higher wages, as the chart below shows.
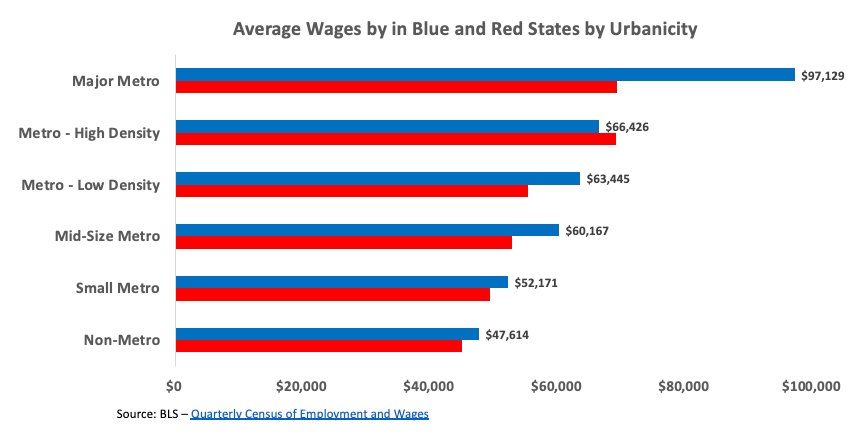
It is also the case that the earnings differences between the nations are not captured by controlling for urbanicity. Almost without exception, in every classification of urbanicity, workers in the Blue Nation earn substantially more.
Labor Relations
Another crucial economic difference between the two “nations” is labor relations. Hostility to unions and other forms of collaborative action by working class Americans – especially multiracial collective action – has long been a defining feature of the Red Nation’s employment regime. It’s not hard to see why; many studies have shown that union membership promotes cross-racial solidarity and progressive values. For instance, Jacob Grumbach and Paul Frymer report that being a union member makes white workers more racially tolerant and more supportive of policies that benefit Black Americans. Grumbach and Frymer also report that in the 21st Century, white union members were between 8 and 14 points more Democratic than non-union members on a 100-point scale.
We’ll begin by looking at the union divide narrowly, in terms of union representation. Union members make up nearly three times the share of those employed in the Blue Nation as they do in the Red Nation. Only 12 percent of those in Red America are not constrained by Right to Work laws; none in Blue America are. And in 2020, about 30 percent of voters in Blue America were or had been members of unions, half again as many as were in Red America. (And Blue Nation union members who have retired to warmer climes make up a big part of that Red Nation number.)
But that comparison greatly understates the impact that strong unions in the Blue Nation have on the well being of all working people, whether they are themselves in a union or not. The next chart compares the worker protection regimes in the two nations. In every category - wages, family friendly policies, workplace rights, pay equity, and unemployment insurance, all working people come out way ahead in the Blue Nation.
Notes
(1) Throughout, I’m using the same definitions of “Blue” and “Red” states that I used to define Blue and Red Nation in “A House Divided.” Blue States (California, Colorado, Connecticut, Delaware, Hawaii, Illinois, Maine, Maryland, Massachusetts, Minnesota, New Jersey, New Mexico, New York, Oregon, Rhode Island, Vermont, Washington), Red States (Alabama, Alaska, Arizona, Arkansas, Florida, Georgia, Idaho, Indiana, Iowa, Kansas, Kentucky, Louisiana, Mississippi, Missouri, Montana, Nebraska, North Carolina, North Dakota, Ohio, Oklahoma, South Carolina, South Dakota, Tennessee, Texas, Utah, West Virginia, Wyoming), Purple States (Michigan, Nevada, New Hampshire, Pennsylvania, Virginia, Wisconsin)


