

How Trump “Won”
The Anesthetized Anti-MAGA Majority

With all the ballots counted and all the races decided, in today’s post, I want to unpack what we already know about how Trump “won” the popular vote.1 I use quotes around the word “won” for two reasons.
First, to keep in full view what I wrote earlier in “Is This What Democracy Looks Like?” – that Trump’s candidacy was only viable because the justices he appointed to the Supreme Court: (1) disabled the insurrection clause of the 14th Amendment (which should otherwise have barred him from holding office again) and (2) shielded him from standing trial before the election for trying to overturn the 2020 results or for hoarding classified documents (which would have kept his criminality in full view of the electorate, and possibly rendered his candidacy a non-starter due to a jail sentence or loss of support). In any other country, we would understand that as part of an autocratic takeover, not a democratic victory.
Second, as this post will show, the results are best understood as a vote of no confidence in Democrats, not an embrace of Trump or MAGA.
Visualizations like this one from FiveThirtyEight, purporting to show that “America swung right,” have been ubiquitous since the election.

But, as we will see, America didn’t swing rightward, but couchward:
The popular vote result was almost entirely a collapse in support for Harris and Democrats, not an increase in support for Trump and MAGA. Trump was no more popular this year than four years ago, while Harris significantly underperformed Biden 2020.
Most of Harris’s losses were due to anti-MAGA surge voters staying home.2 She lost the most ground in deep-Blue urban areas, where the dangers of a second Trump administration seemed most remote. About 19 million Americans who cast ballots for Biden in 2020 did not vote in 2024.
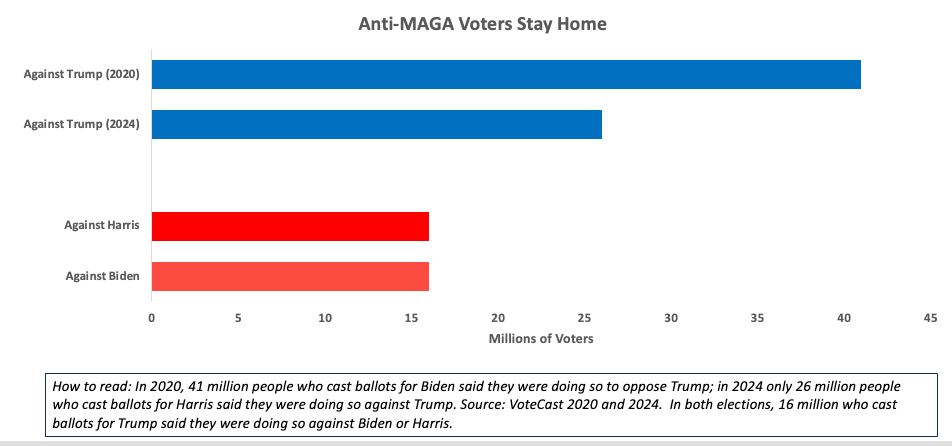
Anti-MAGA surge voters stayed home because they were less alarmed by a second Trump Administration than they were four years ago. A key to Biden’s victory was high turnout from less-engaged voters who believed they had something to lose under Trump. In 2024, however, about 15 million fewer votes were cast “against” Trump than in 2020.
As I’ve been saying for years, America has an anti-MAGA majority, but not necessarily a pro-Democratic one. In 2020 (and 2022, in part), alarm about Trump and MAGA was enough to overcome the cynicism and alienation of mostly younger voters who desperately want bigger systemic change, but who oppose the MAGA agenda. This time, their cynicism won out. This was in no small part because the media and other non-partisan civil society leaders were themselves more skeptical of the dangers, and because the inaction of the Biden Administration and Democrats in Congress against MAGA threats belied their rhetoric of existential dangers to the nation.3
This map, from the New York Times, does a much better job making clear where Trump’s “gains” came from – namely, from Harris’s losses.

Indeed, the defining feature of American politics this century is that neither party can “win” elections anymore; they can only be the “not-loser.” Only thanks to the two-party system can the not-loser be crowned the “winner,” since there is no way to fire the incumbent party without hiring the opposition party. Yet political commentators keep confusing shifts in the two parties’ electoral fortunes with changes in voters’ basic values or priorities. A collapse in support for Democrats does not mean that most Americans, especially in Blue America, are suddenly eager to live in an illiberal theocracy.
Consider that only once before in American history have three consecutive presidential elections seen the White House change partisan hands, and that nine out of the last ten midterm or presidential elections have been “change elections,” in the sense that either the presidency, the House, or the Senate changed partisan hands, which is completely unprecedented.4

In short, Americans are fed up. This election wasn’t just a vote of no confidence in Democrats; it was yet another vote of no confidence in our entire political system. We cannot mistake this result for an active embrace of Trump or MAGA fascism.
Prologue: Escape from Flatland
The idea that “America swung right” seems self-evident based on the shift in vote margin towards Trump. But this is what I call “Flatland” thinking – a metaphor for a fatal flaw in most election analysis.
In the two-dimensional Flatland,5 we only count the people who voted and ignore those who were eligible but didn’t, for basically two reasons. First, from a pragmatic perspective, those who don’t vote literally do not count towards the final result. Second, it’s taken for granted that if they had voted, their partisan split would have been similar to those who did vote, and would not have changed the outcome.
In 3D-Land, however, we include eligible non-voters in our analysis. This is important not because it will change the outcome, or bolster post-hoc finger pointing with new “what-ifs,” but because it will let us better understand the meaning of the vote, as well as where the best hopes for the future lie.
Red Sox vs. Yankees
Here’s a simple illustration. Let’s say we are told that in a 1985 vote for the most popular baseball team, there were 499 votes for the Red Sox and 460 votes for the Yankees, and another 541 fans who didn’t vote for either. (Full disclosure: I grew up in Boston.) In my lexicon, a Flatland description of the results would be that the Red Sox won 52 to 48 percent, and a 3D-Land description would be that the Red Sox won 33.3 to 30.7 percent, with 36.1 percent staying home.6
Now, let’s say that there’s another baseball fan vote in 1986, after the Red Sox blew the World Series to the Mets in 7 games when Bill Buckner allowed a routine ground ball to roll between his legs in game 6.

This time, just 424 fans vote for the Red Sox, and once again 460 vote for the Yankees. In Flatland, the result is reported as a complete reversal, 52 to 48 percent win for the Yankees. But in 3D-Land, where we consider the results in the context of all 1,500 fans who could have voted, the results would be reported as Yankees 30.7 percent, Red Sox 28.3 percent, with 41.1 percent not voting.7

As this graph and the next one make clear, here’s the key difference. Flatland reporting keeps us from seeing whether the result was due to the Yankees gaining fans, or the Red Sox losing fans, or some combination of both.
Now, let’s think about how both approaches influence how we think about political trends, first in terms of baseball. This graph shows only the change in each team’s percentage of the vote from 1985 to 1986.

In Flatland, the Yankees PR department would boast about gaining fans, as they had persuaded Red Sox fans to finally accept their superiority, while the Boston Globe sports columnists would bemoan the choices made by the Sox brass. Flatland data would support either claim equally; we’d have no way of knowing which interpretation was “right,” unless we were willing to step outside to settle it.
On the other hand, in 3D-Land, there would be nothing to debate – it would be obvious that the Red Sox lost fans (falling 5 points, from 33.3 to 28.3 percent) while the Yankees gained none (holding steady at 30.7 percent).8
Blue vs. Red
Now, let’s look at the real world. Compare the partisan swings for the last 50 years of presidential elections in Flatland (left panel) to 3D-Land (right panel). Flatland dictates (and therefore mirrors) our understanding of presidential politics, where each party’s loss is definitionally the other party’s win. (Did Trump do 6 points better than he had four years ago, or did Harris do 6 points worse than Biden did? Who knows!) But in 3D-Land we see how myopic that is. In fact, we have three types of elections: switching, firing, and hiring.

Switching elections are those where we can see that voters mostly switched sides. In this period 1976 is most clearly such an election, since Carter gained 6.5 points compared to McGovern in 1972, and Ford lost 7.7 points compared to Nixon.
Hiring elections are those where there’s not much change in the vote for the losing side, but gains for the winning side. 1984 and 2000 stand out as hiring elections.
Firing elections are those where there’s not much change in the vote for the winning side, but fewer votes for the losing side, as was the case in 1992, 2016 and 2024.
Don’t Ask, Can’t Know
Now, back to baseball. Here’s something important that I didn’t mention earlier: the pool of 1,500 voters included fans of all 30 teams in Major League Baseball, but the only two teams on the ballot were the Yankees and the Red Sox. Knowing this, we can quickly understand why so many people didn’t vote at all, and we should realize how little this election can tell us about the two teams’ actual fan bases. If the Chicago Cubs were on the ballot too, they would get plenty of votes – and they would also reduce the number of votes for both the Red Sox and the Yankees, as a number of National League fans who were casting ballots against one or the other simply out of spite would rally behind their league’s candidate.
Now, let’s see how our real elections look in 3D-Land when we include third-party candidates (gray) and consider the change in overall turnout rates (the black horizontal bars). With that in mind, we can see how much more Flatland hides. First, when there is a viable third party candidate like Perot, turnout goes up – the turnout rate jumped 5.3 points in 1992, the largest jump since the 10-point surge after WWII demobilization. So there are clearly many who don’t vote, but would vote given the right candidate. And we can also see that many who do vote for one or the other choices they’re offered would really prefer another option they are not offered. (The Cubs!) And it offers many other fascinating insights we easily overlook.9

Trump and MAGA Didn’t Get More Popular
Now, back to the idea that America “swung right” by electing Trump.
In Flatland, we could argue that Trump gained, or America swung to the right, by 6 points from Biden +4.5 to Trump +1.5), or about 7.1 million votes. Or we could argue the opposite, i.e. that Democrats lost 6 points, etc.
Flatland dooms us to Rubin’s Vase debates – we can argue with each other (until we’re blue or red in the face) about whether it’s two lovers or just a vase, but there’s no information within the image to argue that one view is more justified than the other. Likewise with election analysis. That’s why we have such vigorous talk past each other debates about what Trump did “right” and what Harris did “wrong.”

But in 3D-Land, we can see clearly who gained and who lost.
Here’s how we know that 2024 was much more about Democrats’ loss than MAGA’s gain.
Trump’s share of eligible voters was the same as it was four years ago.
While Trump won 3 million more votes this year than in 2020, he won the same share of the eligible population (CVEP) as he did four years ago (32%).10 (Unlike in my Red Sox example, the number of eligible voters in the U.S. is constantly increasing.)
Meanwhile, Harris’s share of eligible voters fell to 31.1 percent, a 3.5 point drop from Biden.

Trump’s victory was historically narrow.
Whether in terms of the Flatland two-party vote or the 3D-Land margin among eligible voters, it was one of the narrowest victories in a century.11

Trump’s swing was historically low for a change election.
Of the 14 presidential “change” elections since 1920 (when the presidency switched parties), the smallest swings have been in the 21st Century – and Trump’s two swings are the two smallest in terms of eligible voters, and third smallest and smallest in terms of the two-party vote. It’s also worth noticing how much smaller the swings are in terms of the eligible vote.

Moreover, the swing was substantially less in the battleground states, where voters were more aware of the dangers of a second Trump Administration. In 3D-Land, the swing was just 2.2 points in the battleground states compared to 4.4 points in the rest of the country. (In Flatland, it was just 3.2 points in the battleground compared to 6.8 points in the rest of the country.) More below.
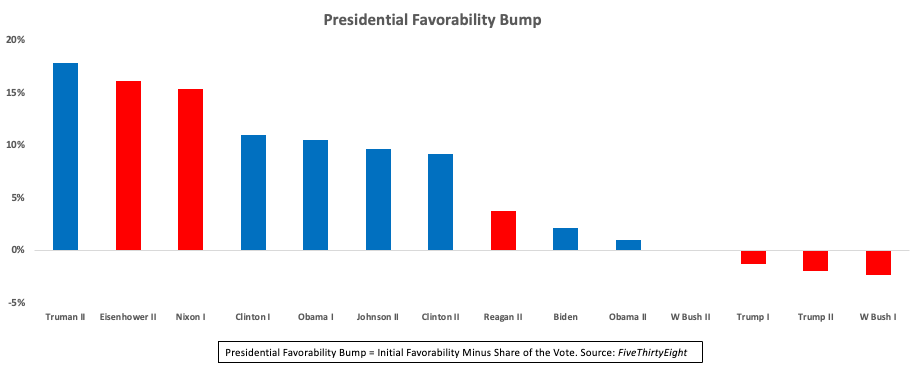
Trump’s favorability is underwater despite the usual winner’s boost.
According to FiveThirtyEight.com, Trump’s approval is at 48 percent. The following graph shows the difference between each president’s post-election favorability and their share of the vote.12 Presidents tend to be seen favorably by more Americans than voted for them initially, in their so-called honeymoon period. As you can see, Trump’s post-election favorability trailed his share of the vote in both 2017 and now. That is especially telling now, as it puts the lie to the idea that he “won.”
External factors heavily favored Trump.
Consider these two graphics from the Wall Street Journal. On the left, we see that the US and the UK suffered the highest inflation; on the right, we see by how much less Democrats’ vote share declined in 2024 than incumbent parties’ vote share in the UK or similar nations in which inflation was lower than in the United States.
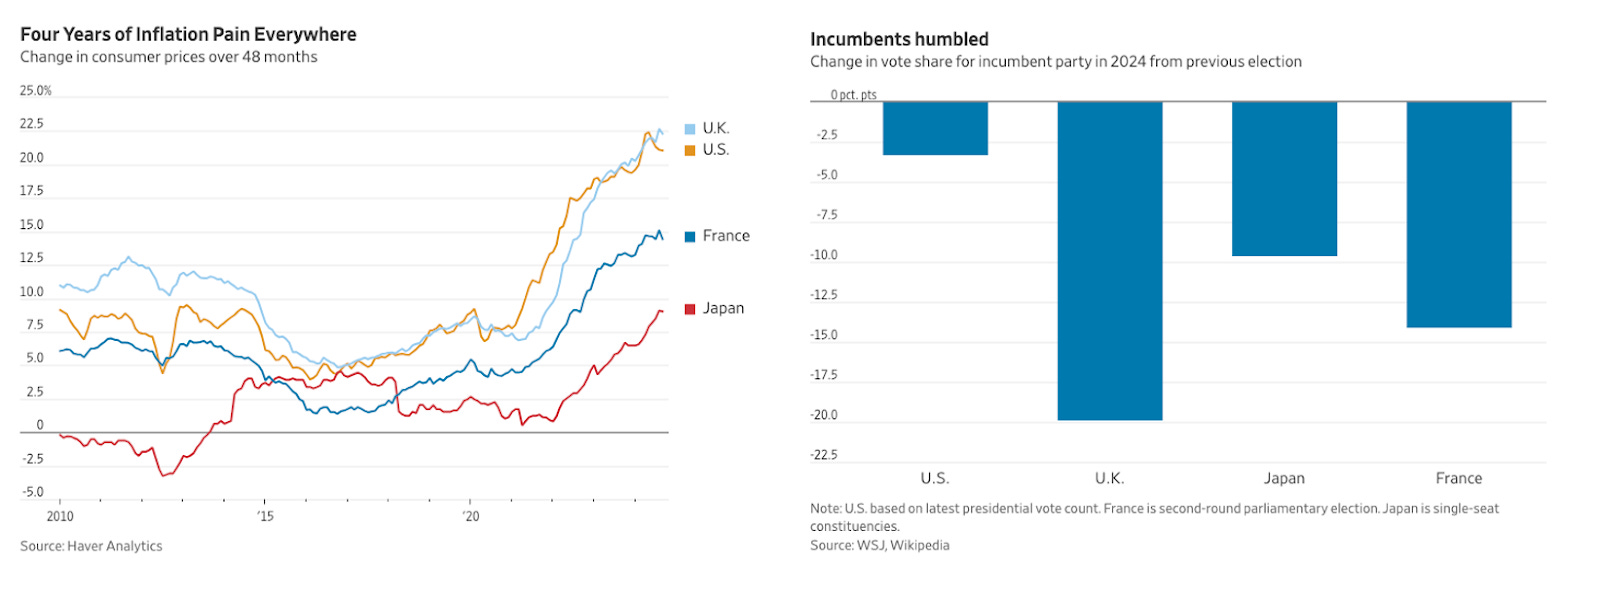
A number of comparisons have been made to the fate of other incumbent governments standing for election this year, but I think this one from FiveThirtyEight is the most comprehensive and clear.

Moreover, more people thought the nation was off on the wrong track this year than in 2008 after the Crash.

All of this helps explain why most of the pre-election forecasting models that did not include Trump favorability as a major factor forecast a Trump win. Indeed, it’s likely that nearly any other Republican nominee without Trump’s baggage would have won a more decisive victory, as was also the case in 2016.13
Very few Biden voters switched to Trump.
This year, VoteCast asked the following question:

Only 4 percent of returning Biden voters cast ballots for Trump in 2024 – roughly the same share of returning Trump voters who cast ballots for Harris, or about 5 million voters combined.14 In other words, vote-switching was basically a wash in terms of the final result.
This is consistent with the diminishing number of partisan defections in the last several elections:

And, although I’ll have much more to say about this when the voter files are in, it’s very much worth flagging that according to both VoteCast and Navigator, in the battleground states there were fewer shifters from Trump to Harris than there were from Biden to Trump, raising some flags about the payoff for appeals to non-MAGA Republicans in the region.
Republicans fared poorly where Trump made his greatest “gains.”
Although the Blue states “swung right” by 7 points, Trump increased his share of eligible voters in those states by only 3/10 of a percentage point. (Harris’s share dropped by 5 points!) Also consider that, despite those hurricane-force winds “blowing to the right,” in the Blue states:
Republicans lost three House seats in the 20 most Democratic urban Blue counties (more below).
Republicans lost seven House seats in the Blue states overall.
Republicans flipped just one of the 18 Cook rated Democratic seats in the Blue states.
Republicans did not come close in any of the 15 Senate races in Blue states, including Maryland, where the popular former governor lost by 12 points.
Harris Lost Ground with Anti-MAGA Voters
As regular readers might recall, Biden won in 2020 thanks to a surge of new and less-frequent voters who hadn’t shown up in 2016, and who voted much more Democratic than 2016 voters. These surge voters were the critical “anti-MAGA but not necessarily pro-Democrat” bloc that Harris needed to turn out again in order to win.
This year, based on VoteCast data (see chart in the previous section), we can estimate that about 19 million people who voted for Biden four years ago stayed home. (40 percent of those voting in 2024 had voted for Biden in 2020, and 40 percent had voted for Trump. From there, it’s simple arithmetic.15) Moreover, with the same caveats until the voter files are updated, both VoteCast and Navigator found that in the battleground states, a greater share of 2020 Trump voters than Biden voters cast ballots in 2024, albeit by a smaller margin than in the rest of the country.
VoteCast also asked whether voters cast ballots “for” the candidate they chose or “against” the other candidate.16 The results show that about 15 million fewer votes were cast “against” Trump in 2024 than in 2020. That suggests a lot of missing “anti-MAGA but not pro-Democrat” voters.
Finally, as a recent Data for Progress survey found, even Trump voters realize that the results were due more to rejecting Democrats (53 percent) than to embracing Republicans (38 percent). And about a third of Harris voters agree that the results were a rejection of Democrats.17 And 72 percent of Harris voters said they “would have preferred other options.”

Blue County Blues
Now let’s look at where Harris fell short of Biden, by region and urbanicity. Even though only about 40 percent of the votes were cast in urban counties, losses in those counties accounted for more than 55 percent of Harris’s losses compared to 2020. Add suburbs in Blue states, and 70 percent of Harris’s losses were suffered in the most reliably Blue parts of the country.

A reminder that when I talk about “Blue” and “Red,” I’m talking about something much bigger than partisanship. I’m talking about the fundamental split between liberalism (Blue) and illiberalism (Red) that goes back to the founding, and that makes America function much more like two separate nations than a single united one. Unfortunately, commentators confuse shifts in the Democratic Party’s electoral fortunes with the changes in priorities of voters in either region. Those priorities are much more stable and much better reflected in the two regions’ respective commitments to vastly different social and economic policies.
A closer look at the bluest-of-the-blue urban counties shows both Harris’s losses and Trump’s lack of gains. This graph shows the change in number of votes for each candidate compared to 2020 (the blue/red bars), as well as Trump’s margin gain (the black dots), in the 20 most Democratic18 urban counties in Blue states. In those 20 counties alone, Harris trailed Biden’s vote total by 2.9 million – more than her entire popular vote loss nationwide – while Trump improved his vote total by just 150,000 votes, out of 25.6 million registered voters.

If you are trapped in Flatland, you’ll swallow the idea that Los Angeles swung 11 points “to the right.” But in 3D-Land, you’ll see that in a county with more than 5 million registered voters, Trump received just 38 thousand more votes than he did four years ago – but Harris received 620 thousand fewer votes. And you’ll see that in those 20 Blue counties, nearly 100 percent of the 11-point change from 2020 was the decrease in votes for Harris.
The 3D-Land view confirms what common sense would dictate: Neither Trump nor MAGA was any more popular in deep-Blue urban areas like Los Angeles than they were four years ago. Those urbanites may or may not be committed Democrats – but they have not suddenly become less supportive of abortion rights or more eager to see their neighbors deported than they were four years ago, and they’re not more likely to elect Republican mayors or city council members to govern them. Much like the 1986 Red Sox fans didn't suddenly become Yankee fans, Democratic-leaning voters didn’t suddenly go MAGA.19
An Alarming Lack of Alarm
It’s no coincidence that the places where turnout and Democratic support collapsed the most – Blue urban areas – are also the places where the threats of Trump and MAGA to people’s daily lives would seem the most remote and theoretical.
Ahead of the election, I wrote that the most alarming thing approaching Election Day was how much less alarmed Americans were about a second Trump Administration than they were four years ago. (See Poll Washing Trump’s Fascist Plans, Sleepwalking Our Way to Fascism, About that Times Poll, and A Cure for Turnout Terror.)
The Credulity Chasm
Anat Shenker-Osorio coined the term “credulity chasm” to describe the consistent finding that what separated Harris voters from those who made a different choice – whether sitting out the election, selecting Trump, or voting third party – was not an attraction to the Project 2025 MAGA Agenda. Rather, it was the presence or absence of alarm around what a second Trump administration would portend – more specifically, whether or not voters believed the MAGA Agenda would actually come to fruition, as Anat detailed in her post-election analysis.
In Navigator’s large sample election survey, respondents were asked whether each of six claims about a second Trump Administration “raised legitimate concerns,” were “over the top and exaggerated,” or were criticisms that the respondent hadn't heard before.20 Those who had heard any of those criticisms – whether they believed them or not – favored Harris by an average of 8 points, while Harris lost those who had not heard the criticisms by an average of 49 points. Moreover, specific groups that moved the most away from Democrats, such as blue collar workers, young men, moderates, etc., were all much more likely to have not heard those criticisms. That’s likely the tip of the iceberg, though. Since we don’t have surveys of those who didn’t vote, we can only speculate on how much more unlikely it might be that non-voters in those Democratic-leaning demographic groups heard those critiques, let alone took them seriously.
The Post-election Research Collaborative/ASO Communications findings confirm that what separates Harris and Trump voters is their willingness to believe Trump will carry out his plans on abortion, Social Security, oligarchy, suppression of speech, and so on.
As Anat tells it: “Consider the following post-election survey results. At minimum 71% and up to 82% of Harris voters believe a host of negative things await us, from a national abortion ban to cutting Social Security to slashing public school funding. In contrast, under a third to as few as 16% of Trump voters think these things are likely. Note that if these Trump voters were actually excited about these plans, far more of them would credit them as likely to come to fruition. Folks in this sample who didn’t vote are more clued into the dangers the Trump administration now poses, but they are a minimum of 30 points under Harris voters on every question in this vein.”

Anat adds: “Further, as we heard from this cohort across focus groups, they’re skeptical that electing Democrats would actually prove an effective check on MAGA’s power.”
This is the one-two punch that knocked out Harris’s chances this year: disaffection with Democrats, combined with incredulity at the idea that Trump might actually implement the worst parts of the MAGA agenda.
Misdiagnosing the Election
Let’s return to the difference between the oversimplified Flatland views of election dynamics and the more complete 3D-Land approach. There’s a useful analogy to medical diagnosis: X-rays are great for diagnosing a broken bone, but three-dimensional MRIs can diagnose many brain and nervous system disorders, soft tissue and joint injuries, and cardiovascular disorders that were invisible to X-rays and earlier diagnostic approaches.
When we use the wrong tools, we might not just fail to diagnose an illness – we might misdiagnose it, and prescribe a treatment that is actively harmful to the patient. When Flatland analysts argue that America “moved right,” the prescription tends to be that Democrats should also move right, or at least play nice with Trump to avoid alienating the Americans who supposedly granted him a decisive mandate. The same prescription will be dispensed to civil society and the media.
But that diagnosis completely misses the life-threatening illness America is really struggling with: a billionaire-captured system that doesn’t work for most people, and justifiable disaffection and anger at this system. Americans are fed up, and people are perpetually in the mood to throw the bums out, whoever the bums in charge are. But with only two parties to realistically choose from – plus a democratically illegitimate Electoral College that makes most Americans’ presidential votes all but irrelevant – all of these “change elections” add up to little more than a seesaw that most Americans don’t want to ride in the first place.
And so, nearly 250 years after putting forth the then-revolutionary aspiration for governments “deriving their just powers from the consent of the governed,” we deploy election procedures that can claim no more legitimacy than the seething resignation of the governed.
Weekend Reading is edited by Emily Crockett, with research assistance by Andrea Evans and Thomas Mande.
Nearly all of this post will be concerned with the national vote rather than the Electoral College, for one simple reason: in each of the last three elections, very small shifts in a couple of states would have changed the outcome. Therefore, we should wait until the voter files have been updated in the spring to avoid an irresponsible rush to judgment on what happened in the battleground states.
Likewise, making inferences about Senate Democrats who won where Harris lost will have to wait, as that happened in the Electoral College battlegrounds.
Nonetheless, it is clear that the dynamic was different in the two Sunbelt battlegrounds (Arizona and Nevada) than it was in the other five (Georgia, Michigan, North Carolina, Pennsylvania and Wisconsin). The Sunbelt dynamic was much closer to the national trends while the other five were distinctive in comparison to the rest of the country in terms of voter turnout (no change vs. 4 point drop) and presidential partisan swing (2.7 point drop vs. 6.7 points).
Anti-MAGA surge voters are those voting for Biden in 2020 or Democrats in 2018 or 2022 who had not voted in 2016.
For example, there was no effort to carve out an exemption to enact the Freedom to Vote Act or aggressively prosecute those involved in January 6th beyond those on the Capitol grounds that day.
It is also the third straight election in which neither candidate had net positive favorability. From ANES:

Although I was not aware of it, “Flatland” was not original to me, but to Edward Abbott who wrote “Flatland: A Romance in Many Dimensions” in 1884. Abbott was not thinking about election results, but the more general epistemological problem posed by the number of dimensions we can (or are willing) to see as “real.” It’s cute.
520 and 480 divided by the 1500 fans.
To be clear, the example could have gone the other way; let’s say that in the second vote, 531 people voted for the Yankees and 520 voted for the Red Sox. In Flatland, the result would have been exactly the same as the first vote – Yankees 50.5 to 49.5 – and we’d have the same ambiguous debate about whether the Yankees had become more fans or the Red Sox had fewer fans. But in 3D-Land, we’d again see clearly that the Yankees had more fans.
Of course you can also tell this just by looking at the raw numbers – the Yankees got 460 votes both times, while the Red Sox got more the first time and less the second. But that’s not the way real-world election results are ever compared – and for good reason, given differences in populations.
For example, in 1992, Bill Clinton did only 8 tenths of a percentage point better than Dukakis had! And we need to reconceptualize the run from 2004 through 2016. In 2012, Obama lost more of his own 2008 support than Hillary Clinton lost compared to Obama’s 2012 support.
Here it is going back to 1868:

Technically, Trump gained 4 tenths of one percent of eligible voters.
The series begins in 1920 after the ratification of the 19th Amendment.
Generally the earliest post-election favorability rating available. Obviously, Trump’s is a few weeks away, so I’m using today’s rating. Presidents for whom reasonably early ratings are not available are not shown.
See, for example, Gallup: Political Fundamentals Foreshadowed Trump Victory
4 percent x 80 percent (returning Biden and Trump voters) x 155 million. The Exits have slightly more defections to Trump, 6 percent x 44 percent (returning Biden voters), or about 1.5 million more votes than in the text. But the Exits are suspect in that they have 87 percent of the electorate having voted in 2020, a much, much greater share than any election since 2008, when voter files became available.
40 percent of 155 million ballots cast in 2024 = 62 million Biden voters. Those 62 million are 19 million less than voted for Biden in 2020. Of course, we’ll have no way of knowing whether VoteCast is correct, but it’s important to note that VoteCast’s 2020 shares of voters for either Clinton or Trump in 2016 were (1) high (both nationally and in the states) - they said 80 percent of 2020 voters had voted in 2016, where Catalist reported that 71 percent had, but (2) roughly in line with the partisan differentials reported by both Catalist and Pew. Thus, this back of the envelope exercise passes muster for a ballpark idea of what happened.
VoteCast 2024:
And VoteCast 2020:

National survey, n1195, Data For Progress/Research Collaborative/ ASO Communications, Dec. 14 - 15, 2024. Responses to the question, “Which of the following best describes your view about the 2024 presidential election?”
Based on the 2020 vote.
Examples of some speculation: Is the Urban Shift Toward Trump Really About Democratic Cities in Disarray?, Big cities have faced serious problems lately. But there’s little evidence those problems are what drove voters to the right in November. And a more localized map here.
Those criticisms were:
Trump would only cut taxes for the wealthy and big corporations
Trump would implement the Project 2025 agenda
Trump would ban abortion nationwide
Trump would cut Social Security and Medicare
Trump would act like a dictator and ignore the Constitution
Trump would put our national security at risk, as respected military and national security leaders have said
First, thanks all for reading and thoughtful comments. Rather than answer them separately, here are some thoughts.
First a clarification about not discussing the Electoral College outcome in the post, which I put in the first footnote to not interrupt the flow:
Nearly all of this post will be concerned with the national vote rather than the Electoral College, for one simple reason: in each of the last three elections, very small shifts in a couple of states would have changed the outcome. Therefore, we should wait until the voter files have been updated in the spring to avoid an irresponsible rush to judgment on what happened in the battleground states.
Nonetheless, it is clear that the dynamic was different in the two Sunbelt battlegrounds (Arizona and Nevada) than it was in the other five (Georgia, Michigan, North Carolina, Pennsylvania and Wisconsin). The Sunbelt dynamic was much closer to the national trends while the other five were distinctive in comparison to the rest of the country in terms of voter turnout (no change vs. 4 point drop) and presidential partisan swing (2.7 point drop vs. 6.7 points).
Second, with respect to voter suppression. For new readers, I have written extensively about the profound contribution the Shelby County decision and other Roberts Court rulings have had to suppress votes (see https://www.weekendreading.net/p/voter-suppression-since-shelby.) However, the point of this post was to understand what changed between 2020 and 2024 – again, outside of the battleground, where we don’t have enough information to draw conclusions yet. My focus was largely on the Blue states where Harris saw the biggest decrease in turnout from Biden in 2020. To the extent there were procedural reforms in these states, they made it modestly easier to vote for the most part. But, of course, it should still be more convenient for Americans everywhere to cast their ballots, and it is outrageous that many states continue to pass laws making it harder to vote as the majority of Blue states move in the opposite direction.
Third, with respect to the role of racism and misogyny. Of course, both continue to play a significant role in our elections, both in terms of who voters cast ballots for, and whether they cast ballots at all. I expect that, as was the case after recent elections, there will be worthwhile scholarship when more data becomes available. If you’re not already familiar with their work, I would point you to Chris Parker, Ashley Jardina, Mark Setzler, Rachel Wetts, and Robb Willer. https://www.polsci.ucsb.edu/people/christopher-sebastian-parker; https://blackinsightsresearch.com; https://ashleyjardina.com; https://marksetzler.org/HomeResearch.html; https://2f07d493-b4a5-4a94-9e9b-5880d0f5c5f3.usrfiles.com/ugd/2f07d4_d1667e0cb107465fb0cbef142ce91251.pdf
This is the most realistic post-mortem on the election that I’ve seen.